Beginners Guide to RAC Database Monitoring and Tuning
CPU and Wait Time Tuning Dimensions
When tuning your system, it is important that you compare the CPU time with the wait time of your system. Comparing CPU time with wait time helps to determine how much of the response time is spent on useful work and how much on waiting for resources potentially held by other processes. As a general rule, the systems where CPU time is dominant usually need less tuning than the ones where wait time is dominant. Alternatively, heavy CPU usage can be caused by badly written SQL statements.
Although the proportion of CPU time to wait time always tends to decrease as the load on the system increases, steep increases in wait time are a sign of contention and must be addressed for good scalability. Adding more CPUs to a node, or nodes to a cluster, would provide a very limited benefit under contention. Conversely, a system where the proportion of CPU time to wait time does not decrease significantly as load increases can scale better, and would most likely benefit from adding CPUs or Real Application Clusters (RAC) instances if needed.
RAC-Specific Tuning
Although there are specific tuning areas for RAC, such as instance recovery and interconnect traffic, you get the most benefits by tuning your system like a single-instance system. At least, this must be your starting point. Obviously, if you have serialization issues in a single-instance environment, these may be exacerbated with RAC.
As shown below, you have basically the same tuning tools with RAC as with a single-instance system. However, certain combinations of specific wait events and statistics are well-known RAC tuning cases.
RAC-reactive tuning tools: – Specific wait events – System and enqueue statistics – Enterprise Manager performance pages – Statspack and AWR reports
In this lesson, you see some of those specific combinations, as well as the RAC-specific information that you can get from the Enterprise Manager performance pages, and Statspack and AWR reports. Finally, you see the RAC-specific information that you can get from the Automatic Database Diagnostic Monitor (ADDM).
Analyzing Cache Fusion Impact in RAC
The effect of accessing blocks in the global cache and maintaining cache coherency is represented by:
- The Global Cache Services statistics for current and cr blocks—for example, gc current blocks received, gc cr blocks received, and so on
- The Global Cache Services wait events for gc current block 3-way, gc cr grant 2-way, and so on
The response time for cache fusion transfers is determined by the messaging time and processing time imposed by the physical interconnect components, the IPC protocol, and the GCS protocol. It is not affected by disk input/output (I/O) factors other than occasional log writes. The cache fusion protocol does not require I/O to data files to guarantee cache coherency, and RAC inherently does not cause any more I/O to disk than a nonclustered instance.
Typical Latencies for RAC Operations
| AWR Report Latency Name | Lower Bound | Typical | Upper Bound |
|---|---|---|---|
| Average time to process cr block request | 0.1 | 1 | 10 |
| Avg global cache cr block receive time (ms) | 0.3 | 4 | 12 |
| Average time to process current block request | 0.1 | 3 | 23 |
| Avg global cache current block receive time(ms) | 0.3 | 8 | 30 |
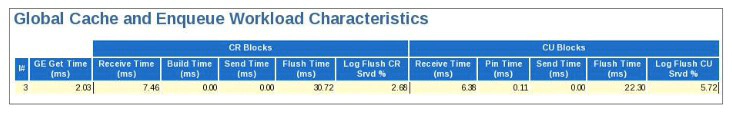
In a RAC AWR report, there is a table in the RAC Statistics section containing average times (latencies) for some Global Cache Services and Global Enqueue Services operations. This table is shown above and is called “Global Cache and Enqueue Services: Workload Characteristics.” Those latencies should be monitored over time, and significant increases in their values should be investigated. The table presents some typical values, based on empirical observations. Factors that may cause variations to those latencies include:
- Utilization of the IPC protocol. User-mode IPC protocols are faster, but only Tru64’s RDG is recommended for use.
- Scheduling delays, when the system is under high CPU utilization
- Log flushes for current blocks served
Other RAC latencies in AWR reports are mostly derived from V$GES_STATISTICS and may be useful for debugging purposes, but do not require frequent monitoring.
Wait Events for RAC
Analyzing what sessions are waiting for is an important method to determine where time is spent. In RAC, the wait time is attributed to an event that reflects the exact outcome of a request. For example, when a session on an instance is looking for a block in the global cache, it does not know whether it will receive the data cached by another instance or whether it will receive a message to read from disk. The wait events for the global cache convey precise information and wait for global cache blocks or messages. They are mainly categorized by the following:
- Summarized in a broader category called Cluster Wait Class
- Temporarily represented by a placeholder event that is active while waiting for a block
- Attributed to precise events when the outcome of the request is known
The wait events for RAC convey information valuable for performance analysis. They are used in ADDM to enable precise diagnostics of the impact of cache fusion.
Wait Event Views
| Wait Event | View |
|---|---|
| Total waits for an event | GV$SYSTEM_EVENT |
| Waits for a wait event class by a session | GV$SESSION_WAIT_CLASS |
| Waits for an event by a session | GV$SESSION_EVENT |
| Activity of recent active sessions | GV$ACTIVE_SESSION_HISTORY |
| Last 10 wait events for each active session | GV$SESSION_WAIT_HISTORY |
| Events for which active sessions are waiting | GV$SESSION_WAIT |
| Identify SQL statements impacted by interconnect latencies | GV$SQLSTATS |
When it takes some time to acquire resources because of the total path length and latency for requests, processes sleep to avoid spinning for indeterminate periods of time. When the process decides to wait, it wakes up either after a specified timer value expires (timeout) or when the event it is waiting for occurs and the process is posted. The wait events are recorded and aggregated in the views shown in the table above. The first three are aggregations of wait times, timeouts, and the number of times waited for a particular event, whereas the rest enable the monitoring of waiting sessions in real time, including a history of recent events waited for.
The individual events distinguish themselves by their names and the parameters that they assume. For most of the global cache wait events, the parameters include file number, block number, the block class, and access mode dispositions, such as mode held and requested. The wait times for events presented and aggregated in these views are very useful when debugging response time performance issues. Note that the time waited is cumulative, and that the event with the highest score is not necessarily a problem. However, if the available CPU power cannot be maximized, or response times for an application are too high, the top wait events provide valuable performance diagnostics.
Global Cache Wait Events: Overview
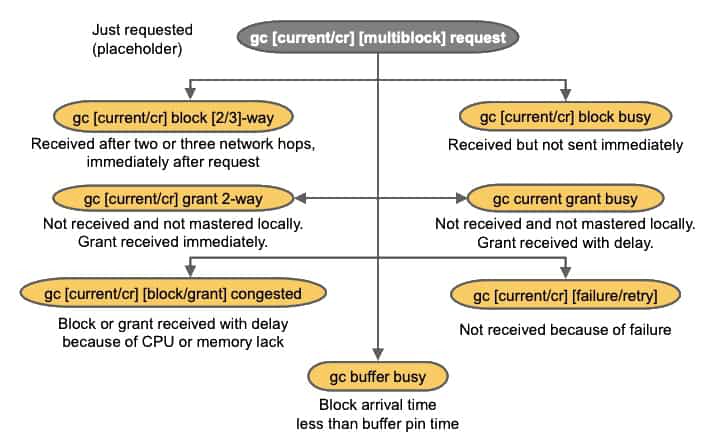
The main global cache wait events are described briefly in the figure above:
- gc current/cr request: These wait events are relevant only while a gc request for a cr block or current buffer is in progress. They act as placeholders until the request completes.
- gc [current/cr] block [2/3]-way: A current or cr block is requested and received after two or three network hops. The request is processed immediately; the block is not busy or congested.
- gc [current/cr] block busy: A current or cr block is requested and received, but is not sent immediately by LMS because some special condition that delayed the sending was found.
- gc [current/cr] grant 2-way: A current or cr block is requested and a grant message received. The grant is given without any significant delays. If the block is not in its local cache, a current or cr grant is followed by a disk read on the requesting instance.
- gc current grant busy: A current block is requested and a grant message received. The busy hint implies that the request is blocked because others are ahead of it or it cannot be handled immediately
- gc [current/cr] [block/grant] congested: A current or cr block is requested and a block or grant message is received. The congested hint implies that the request spent more than 1 ms in internal queues.
- gc [current/cr] [failure/retry]: A block is requested and a failure status received or some other exceptional event has occurred.
- gc buffer busy: If the time between buffer accesses becomes less than the time the buffer is pinned in memory, the buffer containing a block is said to become busy and as a result interested users may have to wait for it to be unpinned.
Global Enqueue Waits
An enqueue wait is not RAC specific, but involves a global lock operation when RAC is enabled. Most of the global requests for enqueues are synchronous, and foreground processes wait for them. Therefore, contention on enqueues in RAC is more visible than in single-instance environments. Most waits for enqueues occur for enqueues of the following types:
- TX: Transaction enqueue; used for transaction demarcation and tracking
- TM: Table or partition enqueue; used to protect table definitions during DML operations
- HW: High-water mark enqueue; acquired to synchronize a new block operation
- SQ: Sequence enqueue; used to serialize incrementing of an Oracle sequence number
- US: Undo segment enqueue; mainly used by the Automatic Undo Management (AUM) feature
- TA: Enqueue used mainly for transaction recovery as part of instance recovery
In all of the preceding cases, the waits are synchronous and may constitute serious serialization points that can be exacerbated in a RAC environment.
Session and System Statistics
Using system statistics based on GV$SYSSTAT enables characterization of the database activity based on averages. It is the basis for many metrics and ratios used in various tools and methods, such as AWR, Statspack, and Database Control.
To drill down to individual sessions or groups of sessions, GV$SESSTAT is useful when the important session identifiers to monitor are known. Its usefulness is enhanced if an application fills in the MODULE and ACTION columns in GV$SESSION.
GV$SEGMENT_STATISTICS is useful for RAC because it also tracks the number of CR and current blocks received by the object.
The RAC-relevant statistics can be grouped into:
- Global Cache Service statistics: gc cr blocks received, gc cr block receive time, and so on
- Global Enqueue Service statistics: global enqueue gets, and so on
- Statistics for messages sent: gcs messages sent and ges messages sent
GV$ENQUEUE_STATISTICS can be queried to determine which enqueue has the highest impact on database service times and, eventually, response times. GV$INSTANCE_CACHE_TRANSFER indicates how many current and CR blocks per block class are received from each instance, including how many transfers incurred a delay.
Most Common RAC Tuning Tips
In any database system, RAC or single-instance, the most significant performance gains are usually obtained from traditional application-tuning techniques. The benefits of those techniques are even more remarkable in a RAC database. In addition to traditional application tuning, some of the techniques that are particularly important for RAC include the following:
- Try to avoid long full-table scans to minimize GCS requests. The overhead caused by the global CR requests in this scenario is because when queries result in local cache misses, an attempt is first made to find the data in another cache, based on the assumption that the chance is high that another instance has cached the block.
- Automatic Segment Space Management can provide instance affinity to table blocks.
- Increasing sequence caches improves instance affinity to index keys deriving their values from sequences. That technique may result in significant performance gains for multi-instance insertintensive applications.
- Range or list partitioning may be very effective in conjunction with data-dependent routing, if the workload can be directed to modify a particular range of values from a particular instance.
- Hash partitioning may help to reduce buffer busy contention by making buffer access distribution patterns sparser, enabling more buffers to be available for concurrent access.
- In RAC, library cache and row cache operations are globally coordinated. So, excessive parsing means additional interconnect traffic. Library cache locks are heavily used, in particular by applications that use PL/SQL or Advanced Queuing. Library cache locks are acquired in exclusive mode whenever a package or procedure has to be recompiled.
- Because transaction locks are globally coordinated, they also deserve special attention in RAC. For example, using tables instead of Oracle sequences to generate unique numbers is not recommended because it may cause severe contention even for a single-instance system.
- Indexes that are not selective do not improve query performance, but can degrade DML performance. In RAC, unselective index blocks may be subject to inter-instance contention, increasing the frequency of cache transfers for indexes belonging to insert-intensive tables.
- Always verify that you use a private network for your interconnect, and that your private network is configured properly. Ensure that a network link is operating in full duplex mode. Ensure that your network interface and Ethernet switches support MTU size of 9 KB. Note that a single-gigabit Ethernet interface can scale up to ten thousand 8 KB blocks per second before saturation
Index Block Contention: Considerations
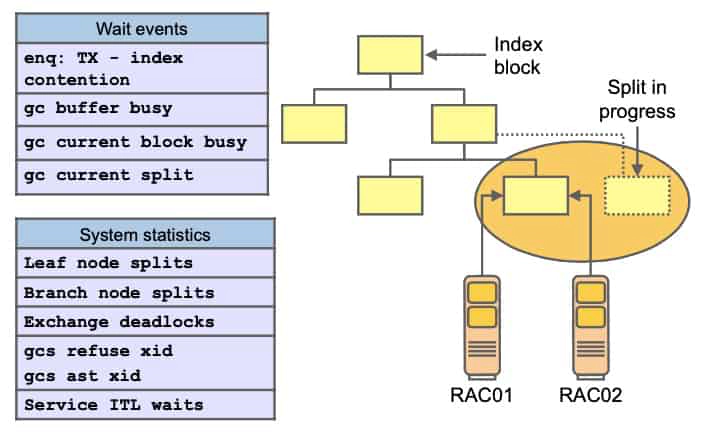
In application systems where the loading or batch processing of data is a dominant business function, there may be performance issues affecting response times because of the high volume of data inserted into indexes. Depending on the access frequency and the number of processes concurrently inserting data, indexes can become hot spots and contention can be exacerbated by:
- Ordered, monotonically increasing key values in the index (right-growing trees)
- Frequent leaf block splits
- Low tree depth: All leaf block access goes through the root block.
A leaf or branch block split can become an important serialization point if the particular leaf block or branch of the tree is concurrently accessed. The tables above sum up the most common symptoms associated with the splitting of index blocks, listing wait events and statistics that are commonly elevated when index block splits are prevalent. As a general recommendation, to alleviate the performance impact of globally hot index blocks and leaf block splits, a more uniform, less skewed distribution of the concurrency in the index tree should be the primary objective. This can be achieved by:
- Global index hash partitioning
- Increasing the sequence cache, if the key value is derived from a sequence
- Using natural keys as opposed to surrogate keys
- Using reverse key indexes
Oracle Sequences and Index Contention
Indexes with key values generated by sequences tend to be subject to leaf block contention when the insert rate is high. That is because the index leaf block holding the highest key value is changed for every row inserted, as the values are monotonically ascending. In RAC, this may lead to a high rate of current and CR blocks transferred between nodes.
One of the simplest techniques that can be used to limit this overhead is to increase the sequence cache, if you are using Oracle sequences. Because the difference between sequence values generated by different instances increases, successive index block splits tend to create instance affinity to index leaf blocks. For example, suppose that an index key value is generated by a CACHE NOORDER sequence and each index leaf block can hold 500 rows. If the sequence cache is set to 50000, while instance 1 inserts values 1, 2, 3, and so on, instance 2 concurrently inserts 50001, 50002, and so on. After some block splits, each instance writes to a different part of the index tree.
So, what is the ideal value for a sequence cache to avoid inter-instance leaf index block contention, yet minimizing possible gaps? One of the main variables to consider is the insert rate: the higher it is, the higher must be the sequence cache. However, creating a simulation to evaluate the gains for a specific configuration is recommended.
If sequences are not implemented properly, performance can be negatively impacted. Setting the sequence CACHE_VALUE too low or overusing non-cached sequences can degrade performance.
If you use sequence numbers, then always use CACHE with the NOORDER option for optimal performance in sequence number generation. With the CACHE option, however, you may have gaps in the sequence numbers. If your environment cannot tolerate sequence number gaps, then use the NOCACHE option or consider pre-generating the sequence numbers. If your application requires sequence number ordering but can tolerate gaps, then use CACHE and ORDER to cache and order sequence numbers in Oracle RAC. If an application requires ordered sequence numbers without gaps, then use NOCACHE and ORDER. The NOCACHE and ORDER combination has the most negative effect on performance compared to other caching and ordering combinations.
Undo Block Considerations
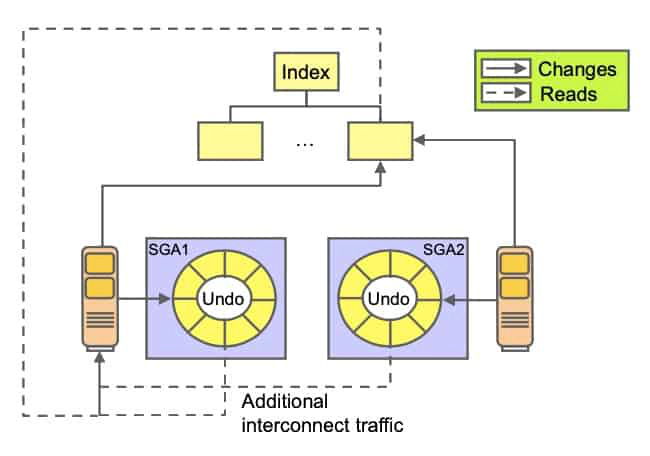
Excessive undo block shipment and contention for undo buffers usually happens when index blocks containing active transactions from multiple instances are read frequently.
When a SELECT statement needs to read a block with active transactions, it has to undo the changes to create a CR version. If the active transactions in the block belong to more than one instance, there is a need to combine local and remote undo information for a consistent read. Depending on the amount of index blocks changed by multiple instances and the duration of the transactions, undo block shipment may become a bottleneck.
Usually, this happens in applications that read recently inserted data very frequently but commit infrequently. Techniques that can be used to reduce such situations include the following:
- Shorter transactions reduce the likelihood that any given index block in the cache contains uncommitted data, thereby reducing the need to access undo information for consistent read.
- As explained earlier, increasing sequence cache sizes can reduce inter-instance concurrent access to index leaf blocks. CR versions of index blocks modified by only one instance can be fabricated without the need of remote undo information.
High-Water Mark Considerations
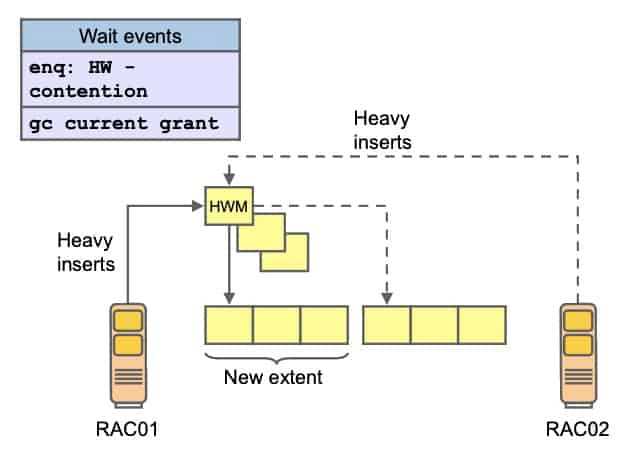
A certain combination of wait events and statistics presents itself in applications where the insertion of data is a dominant business function and new blocks have to be allocated frequently to a segment. If data is inserted at a high rate, new blocks may have to be made available after unfruitful searches for free space. This has to happen while holding the high-water mark (HWM) enqueue.
Therefore, the most common symptoms for this scenario include:
- A high percentage of wait time for enq: HW – contention
- A high percentage of wait time for gc current grant events
The former is a consequence of the serialization on the HWM enqueue, and the latter is because of the fact that current access to the new data blocks that need formatting is required for the new block operation. In a RAC environment, the length of this space management operation is proportional to the time it takes to acquire the HWM enqueue and the time it takes to acquire global locks for all the new blocks that need formatting. This time is small under normal circumstances because there is never any access conflict for the new blocks. Therefore, this scenario may be observed in applications with business functions requiring a lot of data loading, and the main recommendation to alleviate the symptoms is to define uniform and large extent sizes for the locally managed and automatic space-managed segments that are subject to highvolume inserts.
Concurrent Cross-Instance Calls: Considerations
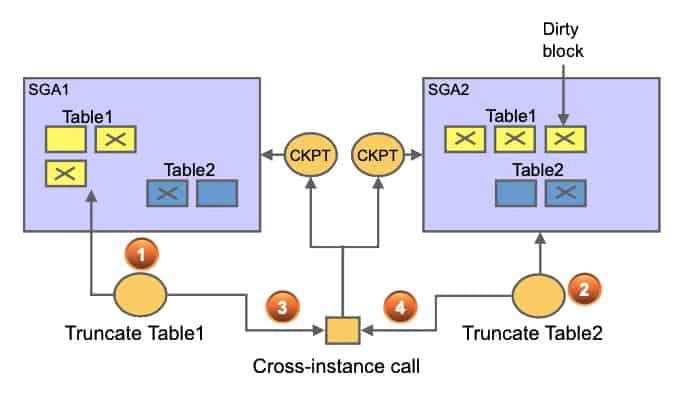
In data warehouse and data mart environments, it is not uncommon to see a lot of TRUNCATE operations. These essentially happen on tables containing temporary data. In a RAC environment, truncating tables concurrently from different instances does not scale well, especially if, in conjunction, you are also using direct read operations such as parallel queries.
As shown in the screenshot above, a truncate operation requires a cross-instance call to flush dirty blocks of the table that may be spread across instances. This constitutes a point of serialization. So, while the first TRUNCATE command is processing, the second has to wait until the first one completes.
There are different types of cross-instance calls. However, all use the same serialization mechanism. For example, the cache flush for a partitioned table with many partitions may add latency to a corresponding parallel query. This is because each cross-instance call is serialized at the cluster level, and one crossinstance call is needed for each partition at the start of the parallel query for direct purpose.
Monitoring RAC Database and Cluster Performance
Both Oracle Enterprise Manager Database Control and Grid Control are cluster-aware and provide a central console to manage your cluster database. From the Cluster Database Home page, you can do all of the following:
- View the overall system status, such as the number of nodes in the cluster and their current status, so you do not have to access each individual database instance for details.
- View the alert messages aggregated across all the instances with lists for the source of each alert message.
- Review the issues that are affecting the entire cluster as well as those that are affecting individual instances.
- Monitor cluster cache coherency statistics to help you identify processing trends and optimize performance for your Oracle RAC environment. Cache coherency statistics measure how well the data in caches on multiple instances is synchronized.
- Determine whether any of the services for the cluster database are having availability problems. A service is deemed to be a problem service if it is not running on all preferred instances, if its response time thresholds are not met, and so on.
- Review any outstanding Clusterware interconnect alerts.
Cluster Database Performance Page
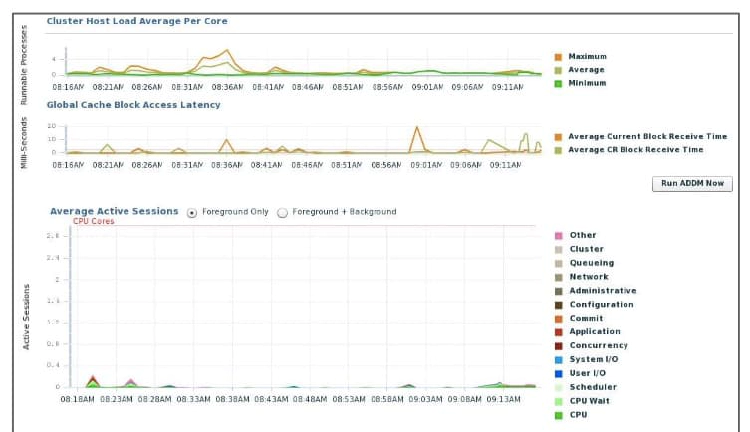
The Cluster Database Performance page provides a quick glimpse of the performance statistics for a database. Enterprise Manager accumulates data from each instance over specified periods of time, called collection-based data. Enterprise Manager also provides current data from each instance, known as real-time data.
Statistics are rolled up across all the instances in the cluster database. Using the links next to the charts, you can get more specific information and perform any of the following tasks:
- Identify the causes of performance issues.
- Decide whether resources need to be added or redistributed.
- Tune your SQL plan and schema for better optimization.
- Resolve performance issues.
The screenshot shows a partial view of the Cluster Database Performance page. You access this page by selecting Performance Home from the Performance pull-down menu from the Cluster Database Home page.
Determining Cluster Host Load Average
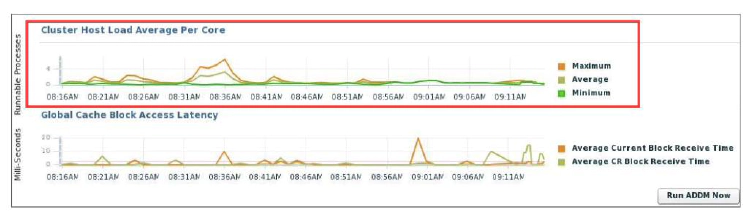
The Cluster Host Load Average chart in the Cluster Database Performance page shows potential problems that are outside the database. The chart shows maximum, average, and minimum load values for available nodes in the cluster for the previous hour.
If the load average is higher than the average of the total number of CPUs across all the hosts in the cluster, then too many processes are waiting for CPU resources. SQL statements that are not tuned often cause high CPU usage. Compare the load average values with the values displayed for CPU Used in the Average Active Sessions chart. If the sessions value is low and the load average value is high, this indicates that something else on the host, other than your database, is consuming the CPU.
You can click any of the load value labels for the Cluster Host Load Average chart to view more detailed information about that load value. For example, if you click the Average label, the Hosts: Average Load page appears, displaying charts that depict the average host load for up to four nodes in the cluster.
You can select whether the data is displayed in a summary chart, combining the data for each node in one display, or using tile charts, where the data for each node is displayed in its own chart. You can click Customize to change the number of tile charts displayed in each row or the method of ordering the tile charts.
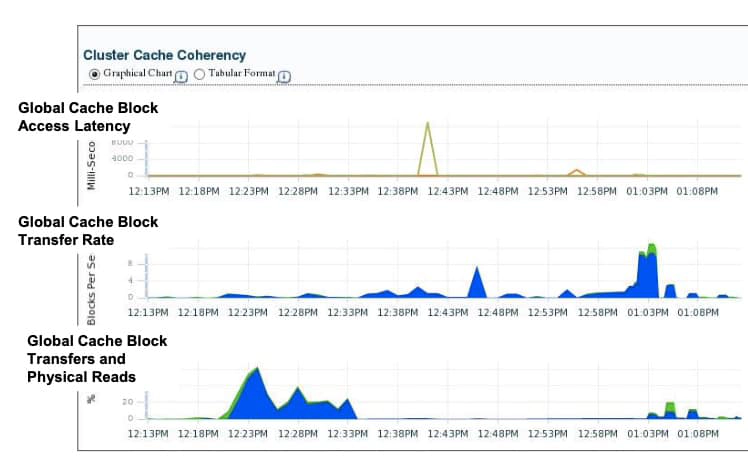
Determining Global Cache Block Access Latency
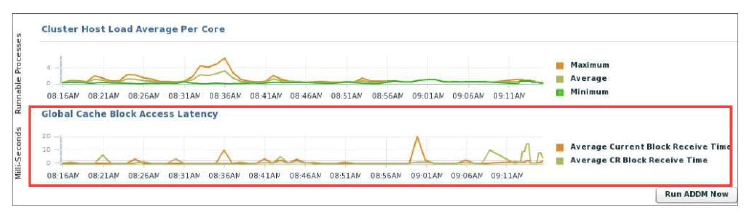
The Global Cache Block Access Latency chart shows the latency for each type of data block request: current and consistent-read (CR) blocks. That is the elapsed time it takes to locate and transfer consistent-read and current blocks between the buffer caches. You can click either metric for the Global Cache Block Access Latency chart to view more detailed information about that type of cached block.
If the Global Cache Block Access Latency chart shows high latencies (high elapsed times), this can be caused by any of the following:
- A high number of requests caused by SQL statements that are not tuned
- A large number of processes in the queue waiting for the CPU, or scheduling delays
- Slow, busy, or faulty interconnects. In these cases, check your network connection for dropped packets, retransmittals, or cyclic redundancy check (CRC) errors.
Concurrent read and write activity on shared data in a cluster is a frequently occurring activity. Depending on the service requirements, this activity does not usually cause performance problems. However, when global cache requests cause a performance problem, optimizing SQL plans and the schema to improve the rate at which data blocks are located in the local buffer cache, and minimizing I/O is a successful strategy for performance tuning. If the latency for consistent-read and current block requests reaches 10 milliseconds, then see the Cluster Cache Coherency page for more detailed information.
Determining Average Active Sessions
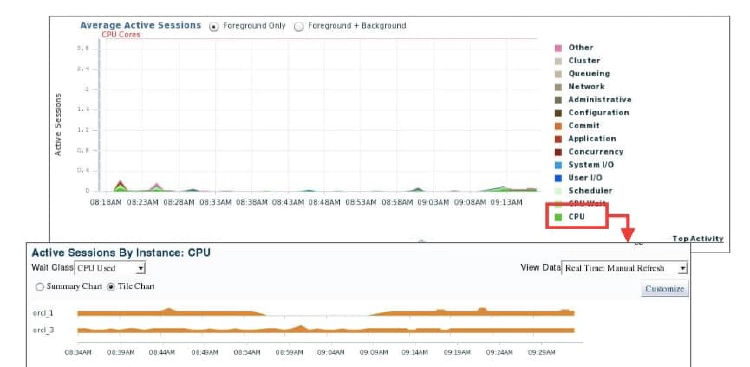
The Average Active Sessions chart on the Cluster Database Performance page shows potential problems inside the database. Categories, called wait classes, show how much of the database is using a resource, such as CPU or disk I/O. Comparing CPU time with wait time helps to determine how much of the response time is consumed with useful work rather than waiting for resources that are potentially held by other processes.
At the cluster database level, this chart shows the aggregate wait class statistics across all the instances. For a more detailed analysis, you can click the Clipboard icon at the bottom of the chart to view the ADDM analysis for the database for that time period.
If you click the wait class legends beside the Average Active Sessions chart, you can view instance-level information stored on the “Active Sessions by Instance” pages. You can use the Wait Class action list on the “Active Sessions by Instance” page to view the different wait classes. The “Active Sessions by Instance” pages show the service times for up to four instances. Using the Customize button, you can select the instances that are displayed. You can view the data for the instances separately by using tile charts, or you can combine the data into a single summary chart.
Determining Database Throughput
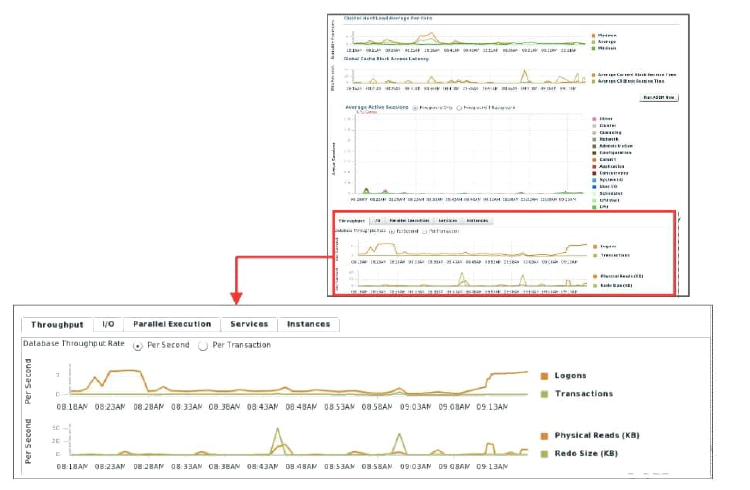
The last chart on the Performance page monitors the usage of various database resources. Click the Throughput tab at the top of this chart to view the Database Throughput chart. Compare the peaks on the Average Active Sessions chart with those on the Database Throughput charts. If internal contention is high and throughput is low, consider tuning the database.
The Database Throughput charts summarize any resource contention that appears in the Average Active Sessions chart, and also show how much work the database is performing on behalf of the users or applications. The Per Second view shows the number of transactions compared to the number of logons, and (not shown here) the number of physical reads compared to the redo size per second. The Per Transaction view shows the number of physical reads compared to the redo size per transaction. Logons is the number of users that are logged on to the database.
To obtain information at the instance level, access the “Database Throughput by Instance” page by clicking one of the legends to the right of the charts. This page shows the breakdown of the aggregated Database Throughput chart for up to four instances. You can select the instances that are displayed. You can drill down further on the “Database Throughput by Instance” page to see the sessions of an instance consuming the greatest resources. Click an instance name legend under the chart to go to the Top Sessions subpage of the Top Consumers page for that instance.
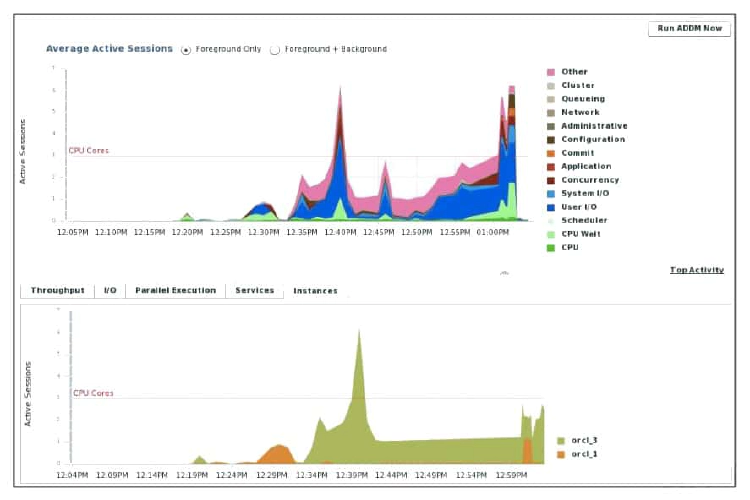
The last chart on the Performance page monitors the usage of various database resources. By clicking the Instances tab at the top of this chart, you can view the “Active Sessions by Instance” chart. The “Active Sessions by Instance” chart summarizes any resource contention that appears in the Average Active Sessions chart. Using this chart, you can quickly determine how much of the database work is being performed on each instance.
You can also obtain information at the instance level by clicking one of the legends to the right of the chart to access the Top Sessions page. On the Top Sessions page, you can view real-time data showing the sessions that consume the greatest system resources. In the graph in the screenshot above, the orcl_3 instance after 12:30 PM is consistently showing more active sessions than the orcl_1 instance.
Accessing the Cluster Cache Coherency Page
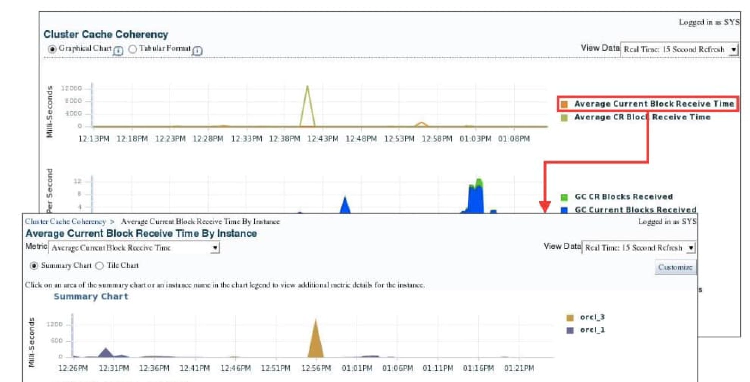
To access the Cluster Cache Coherency page, click the Performance tab on the Cluster Database Home page, and click Cluster Cache Coherency in the Additional Monitoring Links section at the bottom of the page. Alternatively, click either of the legends to the right of the Global Cache Block Access Latency chart.
The Cluster Cache Coherency page contains summary charts for cache coherency metrics for the cluster:
- Global Cache Block Access Latency: Shows the total elapsed time, or latency, for a block request. Click one of the legends to the right of the chart to view the average time it takes to receive data blocks for each block type (current or CR) by instance. On the “Average Block Receive Time by Instance” page, you can click an instance legend under the chart to go to the “Block Transfer for Local Instance” page, where you can identify which block classes, such as undo blocks, data blocks, and so on, are subject to intense global cache activity. This page displays the block classes that are being transferred, and which instances are transferring most of the blocks. Cache transfer indicates how many current and CR blocks for each block class were received from remote instances, including how many transfers incurred a delay (busy) or an unexpected longer delay (congested).
- Global Cache Block Transfer Rate: Shows the total aggregated number of blocks received by all instances in the cluster by way of an interconnect. Click one of the legends to the right of the chart to go to the “Global Cache Blocks Received by Instance” page for that type of block. From there, you can click an instance legend under the chart to go to the “Segment Statistics by Instance” page, where you can see which segments are causing cache contention.
- Global Cache Block Transfers and Physical Reads: Shows the percentage of logical read operations that retrieved data from the buffer cache of other instances by way of Direct Memory Access and from disk. It is essentially a profile of how much work is performed in the local buffer cache, rather than the portion of remote references and physical reads, which both have higher latencies. Click one of the legends to the right of the chart to go to the “Global Cache Block Transfers vs. Logical Reads by Instance” and “Physical Reads vs. Logical Reads by Instance” pages. From there, you can click an instance legend under the chart to go to the “Segment Statistics by Instance” page, where you can see which segments are causing cache contention.
Viewing the Database Locks Page
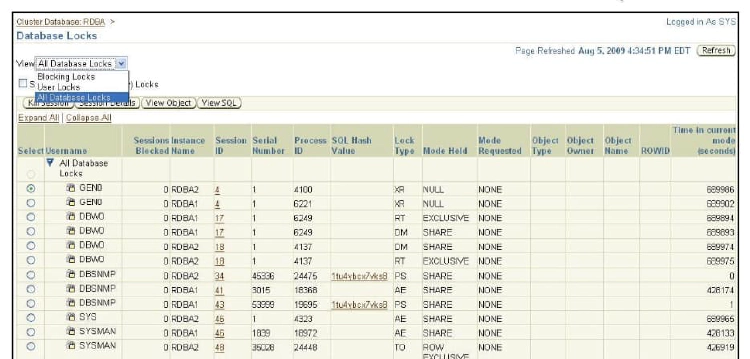
Use the Database Locks link found in the Additional Monitoring Links section to determine whether multiple instances are holding locks for the same object. The page shows user locks, all database locks, or locks that are blocking other users or applications. You can use this information to stop a session that is unnecessarily locking an object.
To access the Database Locks page, select Performance on the Cluster Database Home page, and click Database Locks in the Additional Monitoring Links section at the bottom of the Performance subpage.
AWR Snapshots in RAC
AWR automatically generates snapshots of the performance data once every hour and collects the statistics in the workload repository. In RAC environments, each AWR snapshot captures data from all active instances within the cluster. The data for each snapshot set that is captured for all active instances is from roughly the same point in time. In addition, the data for each instance is stored separately and is identified with an instance identifier. For example, the buffer_busy_wait statistic shows the number of buffer waits on each instance. The AWR does not store data that is aggregated from across the entire cluster. That is, the data is stored for each individual instance.
The statistics snapshots generated by the AWR can be evaluated by producing reports displaying summary data such as load and cluster profiles based on regular statistics and wait events gathered on each instance.
The AWR functions in a similar way as Statspack. The difference is that the AWR automatically collects and maintains performance statistics for problem detection and self-tuning purposes. Unlike in Statspack, in the AWR, there is only one snapshot_id per snapshot across instances.
AWR Reports and RAC: Overview
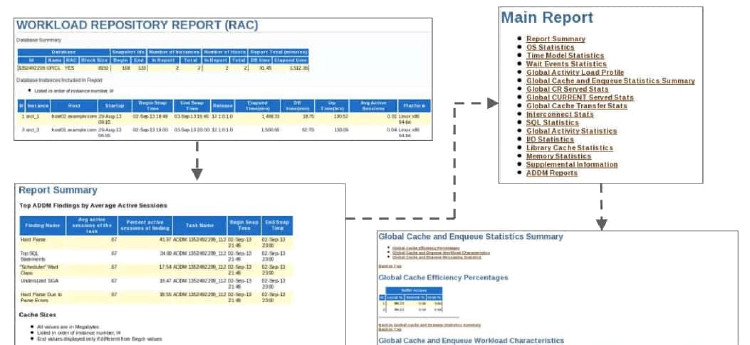
The RAC-related statistics in an AWR report are listed in the AWR report by category. A look at the Main Report menu lists the categories in the report. Available information includes:
- The number of instances open at the time of the begin snapshot and the end snapshot to indicate whether instances joined or left between the two snapshots
- The Global Activity Load Profile, which essentially lists the number of blocks and messages that are sent and received, as well as the number of fusion writes
- The Global Cache Efficiency Percentages, which indicate the percentage of buffer gets broken up into buffers received from the disk, local cache, and remote caches. Ideally, the percentage of disk buffer access should be close to zero.
- Global Cache and Enqueue Workload Characteristics, which gives you an overview of the more important numbers first. Because the global enqueue convert statistics have been consolidated with the global enqueue get statistics, the report prints only the average global enqueue get time. The round-trip times for CR and current block transfers follow, as well as the individual sender-side statistics for CR and current blocks. The average log flush times are computed by dividing the total log flush time by the number of actual log flushes. Also, the report prints the percentage of blocks served that actually incurred a log flush.
- Global Cache and Enqueue Messaging Statistics. The most important statistic here is the queue time on ksxp, which indicates how well the IPC works. Average numbers should be less than 1 ms
The Segment Statistics section also includes the GC Buffer Busy Waits, CR Blocks Received, and CUR Blocks Received information for relevant segments.
Active Session History Reports for RAC
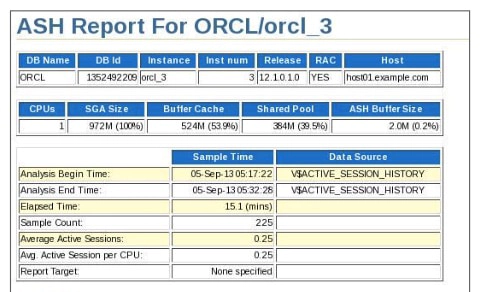
Active Session History (ASH) is an integral part of the Oracle Database self-management framework and is useful for diagnosing performance problems in Oracle RAC environments. ASH report statistics provide details about Oracle Database session activity. Oracle Database records information about active sessions for all active Oracle RAC instances and stores this data in the System Global Area (SGA). Any session that is connected to the database and using CPU is considered an active session. The exception to this is sessions that are waiting for an event that belongs to the idle wait class.
ASH reports present a manageable set of data by capturing only information about active sessions. The amount of the data is directly related to the work being performed, rather than the number of sessions allowed on the system. ASH statistics that are gathered over a specified duration can be put into ASH reports.
Each ASH report is divided into multiple sections to help you identify short-lived performance problems that do not appear in the ADDM analysis. Two ASH report sections that are specific to Oracle RAC are Top Cluster Events and Top Remote Instance.
Top Cluster Events
The ASH report Top Cluster Events section is part of the Top Events report that is specific to Oracle RAC. The Top Cluster Events report lists events that account for the highest percentage of session activity in the cluster wait class event along with the instance number of the affected instances. You can use this information to identify which events and instances caused a high percentage of cluster wait events.
Top Remote Instance
The ASH report Top Remote Instance section is part of the Top Load Profile report that is specific to Oracle RAC. The Top Remote Instance report shows cluster wait events along with the instance numbers of the instances that accounted for the highest percentages of session activity. You can use this information to identify the instance that caused the extended cluster wait period.
Automatic Database Diagnostic Monitor for RAC
Using the Automatic Database Diagnostic Monitor (ADDM), you can analyze the information collected by AWR for possible performance problems with your Oracle database. ADDM presents performance data from a clusterwide perspective, thus enabling you to analyze performance on a global basis. In an Oracle RAC environment, ADDM can analyze performance using data collected from all instances and present it at different levels of granularity, including:
- Analysis for the entire cluster
- Analysis for a specific database instance
- Analysis for a subset of database instances
To perform these analyses, you can run the ADDM Advisor in Database ADDM for RAC mode to perform an analysis of the entire cluster, in Local ADDM mode to analyze the performance of an individual instance, or in Partial ADDM mode to analyze a subset of instances. Database ADDM for RAC is not just a report of reports but has independent analysis that is appropriate for RAC. You activate ADDM analysis by using the advisor framework through Advisor Central in Oracle Enterprise Manager, or through the DBMS_ADVISOR and DBMS_ADDM PL/SQL packages.
You can create a period analysis mode for ADDM that analyzes the throughput performance for an entire cluster. When the advisor runs in this mode, it is called database ADDM. You can run the advisor for a single instance, which is called instance ADDM.
Database ADDM has access to AWR data generated by all instances, thereby making the analysis of global resources more accurate. Both database and instance ADDM run on continuous time periods that can contain instance startup and shutdown. In the case of database ADDM, there may be several instances that are shut down or started during the analysis period. However, you must maintain the same database version throughout the entire time period.
Database ADDM runs automatically after each snapshot is taken. You can also perform analysis on a subset of instances in the cluster. This is called partial analysis ADDM.
I/O capacity finding (the I/O system is overused) is a global finding because it concerns a global resource affecting multiple instances. A local finding concerns a local resource or issue that affects a single instance. For example, a CPU-bound instance results in a local finding about the CPU. Although ADDM can be used during application development to test changes to either the application, the database system, or the hosting machines, database ADDM is targeted at DBAs.
What Does ADDM Diagnose for RAC?
- Latency problems in interconnect
- Congestion (identifying top instances affecting the entire cluster)
- Contention (buffer busy, top objects, and so on)
- Top consumers of multiblock requests
- Lost blocks
- Reports information about interconnect devices; warns about using PUBLIC interfaces
- Reports throughput of devices, and how much of it is used by Oracle and for what purpose (GC, locks, PQ)
Data sources are:
- Wait events (especially Cluster class and buffer busy)
- Active Session History (ASH) reports
- Instance cache transfer data
- Interconnect statistics (throughput, usage by component, pings)
ADDM analyzes the effects of RAC for both the entire database (DATABASE analysis mode) and for each instance (INSTANCE analysis mode).
EM Support for ADDM for RAC
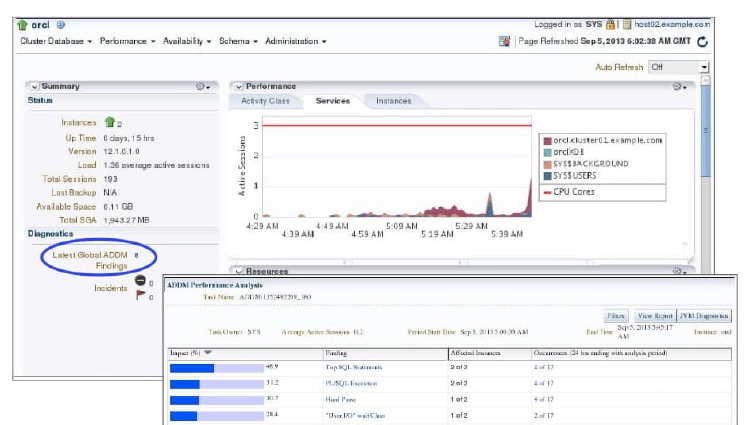
Enterprise Manager displays the ADDM analysis on the Cluster Database Home page. On the Automatic Database Diagnostic Monitor (ADDM) page, the Database Activity chart (not shown here) plots the database activity during the ADDM analysis period. Database activity types are defined in the legend based on its corresponding color in the chart. Each icon below the chart represents a different ADDM task, which in turn corresponds to a pair of individual Oracle Database snapshots saved in the Workload Repository.
In the ADDM Performance Analysis section, the ADDM findings are listed in descending order, from highest impact to least impact. For each finding, the Affected Instances column displays the number (m of n) of instances affected. Drilling down further on the findings takes you to the Performance Findings Detail page. The Informational Findings section lists the areas that do not have a performance impact and are for informational purpose only.
The DB Time Breakdown chart shows how much each instance is impacted by these findings. The display indicates the percentage impact for each instance.
EM Database Express Performance Hub
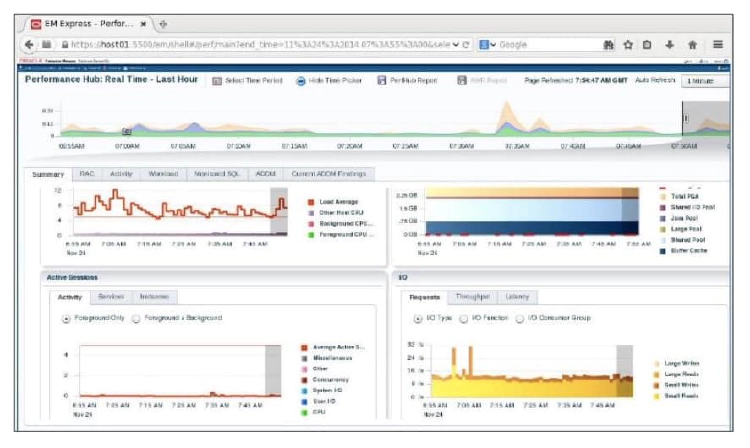
The Performance Hub provides a consolidated view of all performance data for a given time range. The Performance Hub can be used to view both historical and real-time data. In real-time mode, performance data is retrieved from in-memory views. The Performance Hub organizes performance data by dividing it into different tabs.
The Summary tab is available in both real-time and historical modes. In real-time mode, this tab shows metrics data that gives an overview of system performance in terms of Host Resource Consumption (CPU, I/O and Memory), and Average Active Sessions. In historical mode, the tab displays system performance in terms of resource consumption, average active sessions, and load profile information.
The Activity tab displays ASH Analytics, and is available in both real-time and historical modes. The RAC tab displays RAC-specific metrics such as the number of global cache blocks received, and the average block latency. The Monitored SQL tab displays Monitored Executions of SQL, PL/SQL, and Database Operations, and is available in both real-time and historical modes.
The ADDM tab is available in both real-time and historical modes. It displays ADDM and Automatic Real Time ADDM reports. The Current ADDM Findings tab is available only in real-time mode, and displays a real-time analysis of system performance for the past 5 minutes.
Monitoring RAC With Cluster Health Advisor (CHA)
CHA is automatically provisioned on each node by default when Grid Infrastructure is installed for RAC or RAC One Node database. CHA does not require any additional configuration. The credentials of OCHAD daemon user in the Grid Infrastructure Management Repository (GIMR), are securely and randomly generated and stored in the Oracle Grid Infrastructure Credential Store.
When Cluster Health Advisor detects an Oracle RAC or RAC One Node database instance as running, CHA autonomously starts monitoring the cluster nodes. You must use CHACTL, while logged in as the Grid user, to explicitly turn on monitoring of the database.
To monitor the Oracle RAC environment, run the following command:
$ chactl monitor database –db db_unique_name
Run the following command to stop monitoring a database:
$ chactl unmonitor database –db db_unique_name
Run the following command to check monitoring status of all cluster nodes and databases:
$ chactl status
Monitoring nodes host01, host02
Monitoring databases racdb
Cluster Health Advisor monitors all instances of the RAC or RAC One Node database using the default model. CHA cannot monitor single-instance Oracle databases, even if the single-instance Oracle databases share the same cluster as Oracle RAC databases.
CHA preserves database monitoring status across cluster restarts as CHA stores the status information in the GIMR. Each database instance is monitored independently both across Oracle RAC database nodes and when more than one databases run on a single node.