Monitoring a Data Guard Broker Configuration using Enterprise Manager Cloud Control
Enterprise Manager Cloud Control provides a graphical user interface for monitoring the Data Guard configuration. The following sections in this post describe the information that you can view on the Data Guard Overview page and its related pages.
Viewing the Data Guard Configuration Status
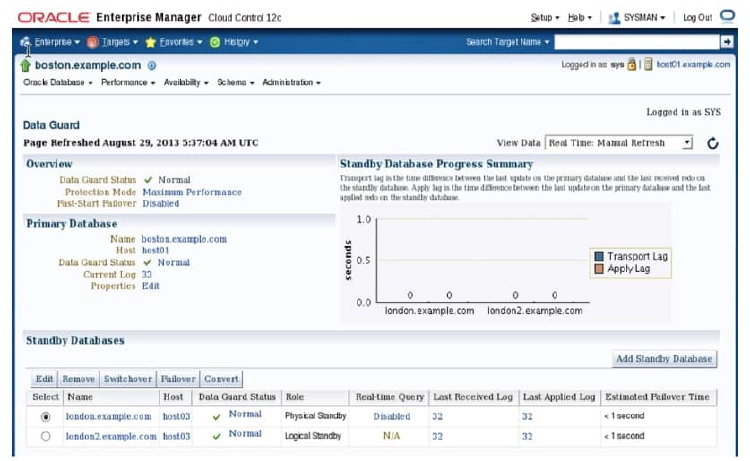
On the Data Guard Overview page, you can view the status of the primary database and the standby databases in a configuration. In the Standby Database Progress Summary section,you can view information about transport and apply lags.
The apply lag shows the approximate number of seconds that the standby database is behind the primary database. A large apply lag may indicate that Redo Apply needs to be tuned or that there is a gap.
The transport lag shows the approximate number of seconds of redo not yet available on the standby database and provides an indication of potential data loss in the event of a disaster.A significant transport lag may be caused by:
- A gap in the redo
- Network bandwidth constraints
- An overloaded log writer network server (LNS) process on the primary database
- Redo generation that is faster than the LNS and network can handle
- I/O issues on the remote file server (RFS) process side
- An overloaded RFS process
- An inadequate number of standby redo log files causing the RFS process to stall or to use archived log files
Monitoring Data Guard Performance
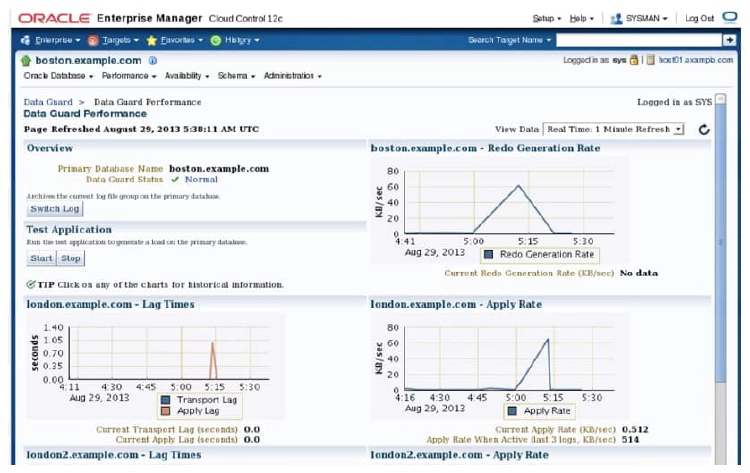
Click Data Guard Performance in the Performance section of the Data Guard Overview page to access the Performance Overview page. The Data Guard Performance page displays detailed performance-related statistics for the Data Guard configuration. The performance charts provide a graphical summary of all redo log activity in the configuration. You can use the View Data drop-down list to set the collection interval (which causes the charts to be refreshed) to determine the rate of sampling of the primary database.
The following charts display performance information for all databases in the configuration:
- Redo Generation Rate: The redo generation rate in KB per second
- Lag Times: The approximate amount of potential data loss. Lag Times shows the transport lag (the approximate number seconds of redo not yet available on the standby database) and Apply Lag (the approximate number of seconds the standby is behind the primary database).
- Apply Rate: The data applied on each standby database in the configuration. Each point on the chart represents the amount of redo data that has been applied since the last time it was refreshed last time it was refreshed.
Click any of the charts to obtain historical information.
Viewing Log File Details
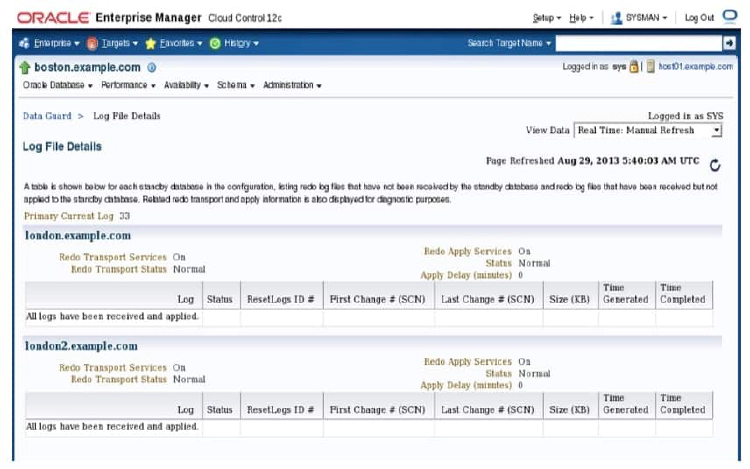
The Log File Details page displays information about the log files that were generated on the primary database and received by the standby database. The information is presented in a tabular format for each standby database in the configuration. The table contains the following columns:
- Log: Contains the log file sequence number
- Status: “Partially Applied,” “Not Applied,” “Not Received”
- ResetLogs ID: Identifier that changes after a terminal recovery and an open with RESETLOGS
- First Change # (SCN): First system change number (SCN) in the log file
- Last Change # (SCN): Last SCN in the log file
- Size (KB): Size of the log file
- Time Generated: Time at which the log file was generated
- Time Completed: Time at which the log file completed
Enterprise Manager Metrics and Alerts
Metrics are units of measurement that are used to assess the health of your system. Each target comes with a predefined set of metrics. Metric thresholds are boundary values against which monitored metric values are compared. Some thresholds are predefined by Oracle; others are not. When a threshold is reached, an alert is generated to indicate that a particular condition was encountered. An alert is triggered when one of the following conditions is true:
- A threshold is reached.
- An alert was cleared.
- The availability of a monitored service changes The availability of a monitored service changes.
- A specific condition occurs. (Example: An alert is triggered when an error message is written to a database alert log file.)
Alerts are detected through a polling-based mechanism by checking for the monitored condition from a separate process at regular, predefined intervals. You can associate an alert with a notification, with the automatic execution of a job, and so on.
Data Guard Metrics
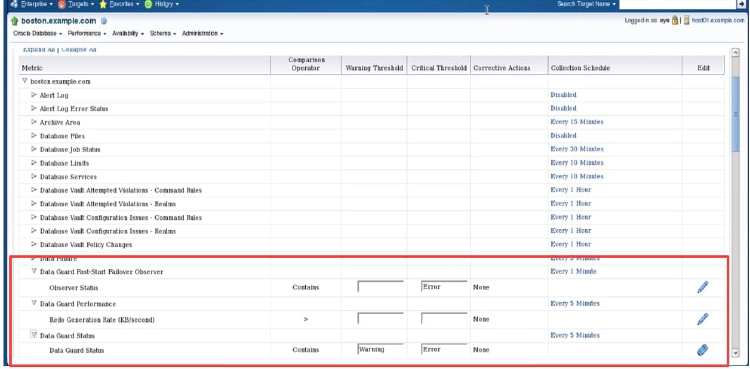
You can use Enterprise Manager to monitor status and log file activity. In addition, Enterprise Manager automatically monitors the status and archived redo log file activity on the primary and standby databases and provides the following metrics:
- Data Guard Failover: When fast-start failover is enabled, this metric generates a critical alert on the new primary database if a fast-start failover occurs.
- Data Guard Fast-Start Failover Observer: This metric displays the current status of the fast-start failover observer. A down status triggers an alert. The observer is a separate OCI client-side component that monitors the availability of the primary database in a fast-start failover configuration. Fast-start failover is discussed in the lesson titled lesson titled “Enabling Fast Enabling Fast-Start Failover Start Failover.”
- Data Guard Performance: This metric provides alerts for performance that is related to redo log activity in the configuration.
- Data Guard Status: This metric checks the status of each database in the broker configuration and triggers a warning or critical alert if necessary.
You can set up Email Services to send you a message if a metric is triggered. See Oracle Data Guard Broker Data Guard Broker for detailed information for detailed information.
Managing Data Guard Metrics
You can specify that an email notification be sent to you when a Data Guard metric is triggered. To configure the notification:
-
Configure notification methods in Enterprise Manager.
- Click Setup at the top of the Database Home page, followed by Notifications and then Notification Methods on the menu tree that appears
- Enter the appropriate information in the Mail Server section and click Apply. Next, click Test Mail Servers to verify your configuration.
-
View the All Metrics page by clicking Database > Monitoring > All Metrics using the menu on the Database Home page.
-
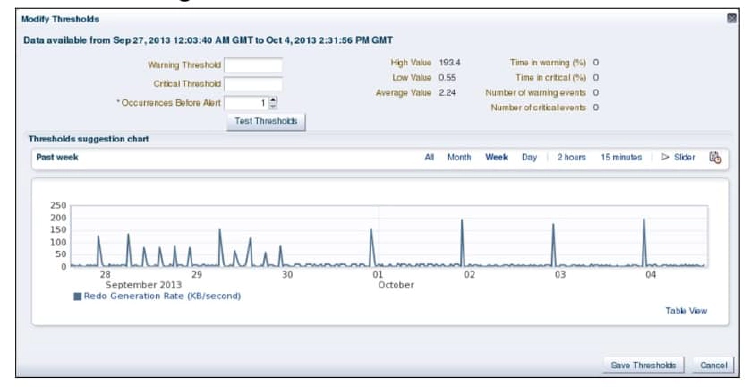
Set or change Data Guard metric thresholds by selecting an individual metric and then clinking the modify Thresholds button within the section dedicated for that metric. Not all metrics have thresholds that can be modified
If a metric condition is triggered or a threshold value is exceeded, an alert is issued. Notifications determine how the alert will be received.
Viewing Metric Value History
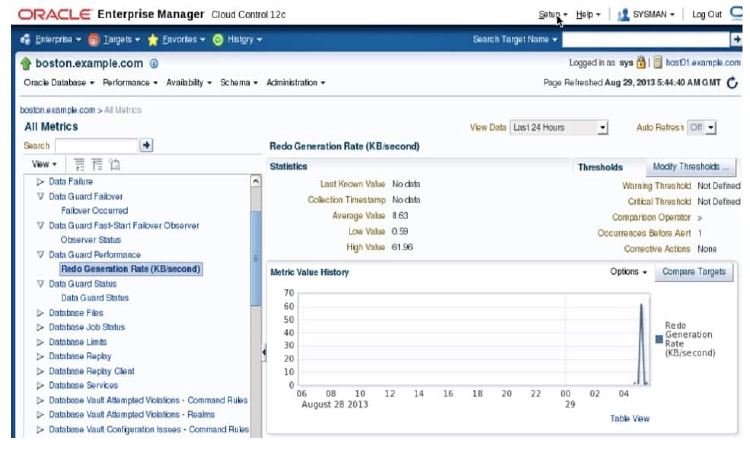
When an alert is triggered, you can view detailed information by clicking the link in the Message field. You can also view metric value history by clicking the metric link in the All Metrics tree view.