Oracle RAC 12c Administration using Enterprise Manager
Enterprise Manager Cloud Control Cluster Database Home Page
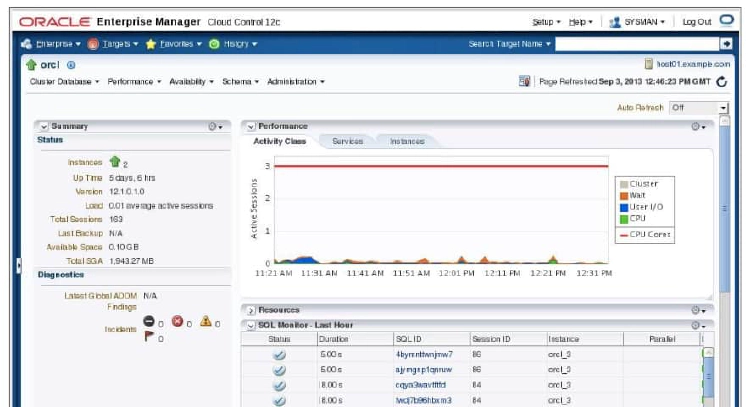
The Enterprise Manager Cloud Control (EMCC) Cluster Database Home page serves as a crossroad for managing and monitoring all aspects of your RAC database. On this page, you find Summary, Performance, Diagnostics, Compliance, Instances, and Incidents sections for information that pertains to your cluster database as a whole. Here, you can see the Summary section showing number of instances up, uptime, software version, and so on. Below the Summary section, you can find the Diagnostics pane with a link to the latest ADDM results. In the Performance section, you can browse session statistics by service or instance. In the Resources section, you can view resource usage grouped by Database or Instance. The SQL Monitor section provides a performance summary of SQL statements executed in the last hour.
The Incidents and Problems table shows all the recent alerts that are open. Click the alert message in the Message column for more information about the alert. When an alert is triggered, the name of the metric for which the alert was triggered is displayed in the Name column.
Cluster Database Home Page
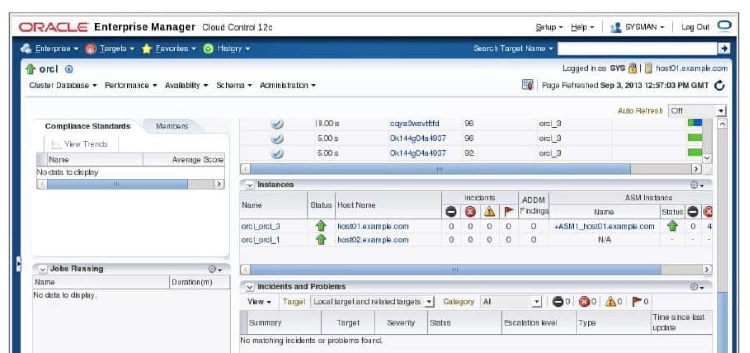
Scanning farther down the cluster database home page, the number of instances is displayed for the RAC database, in addition to their status. A RAC database is considered to be up if at least one instance has the database open. If your cluster database uses ASM for shared storage, the ASM instances will be listed also. Drilling down on any of the instance links will allow you to access summary information for that instance only. Clicking the hostname links will display summary information such as CPU, memory, file system, and network utilization. A hardware configuration summary for the selected host is also displayed.
A Compliance summary is displayed in the left pane of the cluster database home page. Below that section is a Jobs Running summary, allowing you to monitor running jobs at a glance.
Cluster Database Instance Home Page
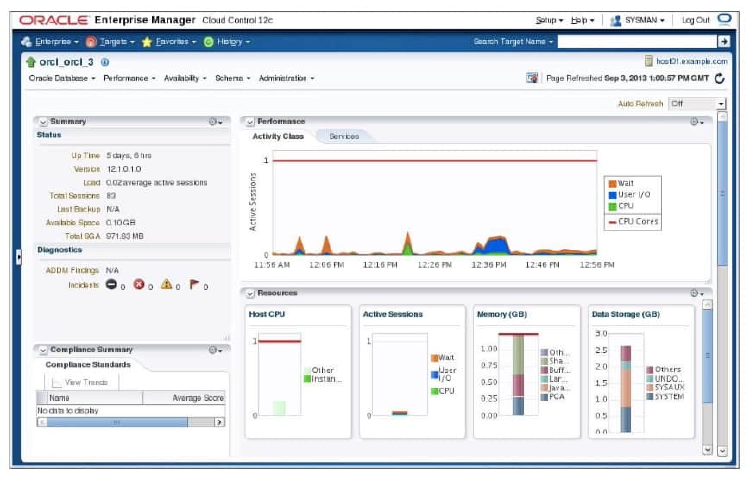
The Cluster Database Instance Home page enables you to view the current state of the instance by displaying a series of metrics that portray its overall health. This page provides a launch point for the performance, administration, and maintenance of the instance environment.
You can access the Cluster Database Instance Home page by clicking one of the instance names from the Instances section of the Cluster Database Home page. This page has basically the same sections as the Cluster Database Home page. The difference is that tasks and monitored activities from these pages apply primarily to a specific instance.
Cluster Home Page
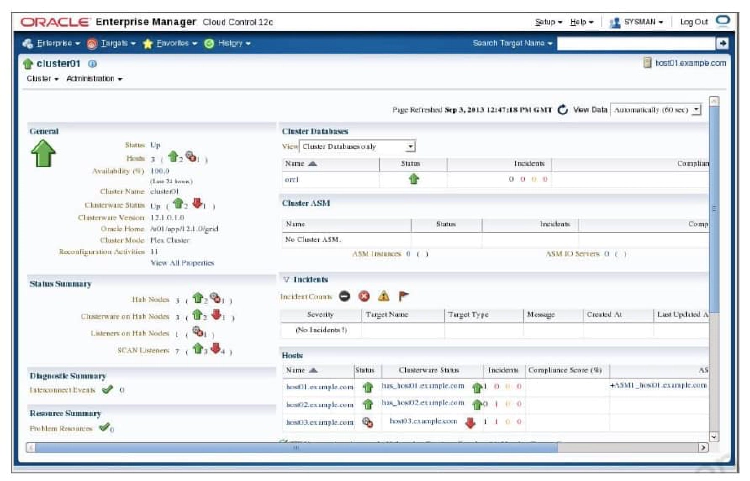
The image above shows you the Cluster Home page, which can be accessed by clicking the Cluster link located in the Targets pull-down menu. Even if the database is down, the Cluster page is available to manage resources. The cluster is represented as a composite target composed of nodes and cluster databases. An overall summary of the cluster is provided here. The Cluster Home page displays several sections, including General, Status Summary, Diagnostic Summary, Cluster Databases, Incidents, and Hosts. The General section provides a quick view of the status of the cluster, providing basic information such as current Status, Availability, Up nodes, Clusterware Version, and Oracle Home.
The Cluster Databases table displays the cluster databases (optionally associated with corresponding services) associated with this cluster, their availability, and any alerts on those databases. The Incidents table provides information about any alerts that have been issued along with the severity rating of each.
The Hosts table displays the hosts for the cluster, availability, corresponding alerts, and CPU and memory utilization percentage.
Topology Viewer
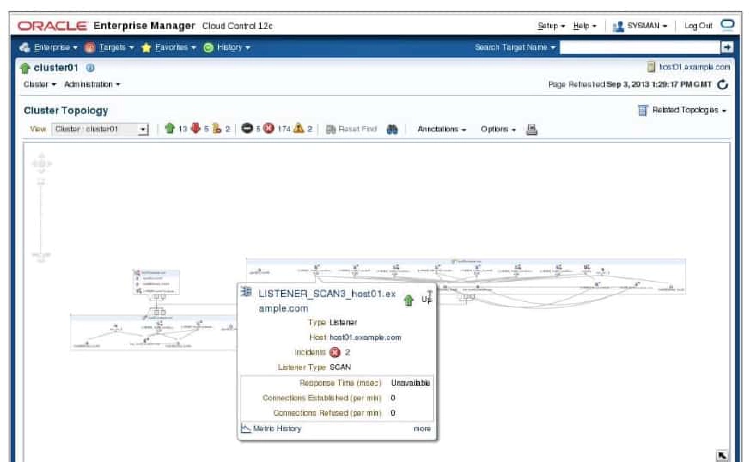
The Topology Viewer enables you to visually see the relationships between target types for each host of your cluster database. You can zoom in or out, pan, and see selection details. These views can also be used to launch various administration functions.
The Topology Viewer populates icons on the basis of your system configuration. If a listener is serving an instance, a line connects the listener icon and the instance icon. Possible target types include:
- Interface
- Listener
- ASM Instance
- Database Instance
You can click an icon and then right-click to display a menu of available actions.
Enterprise Manager Alerts and RAC
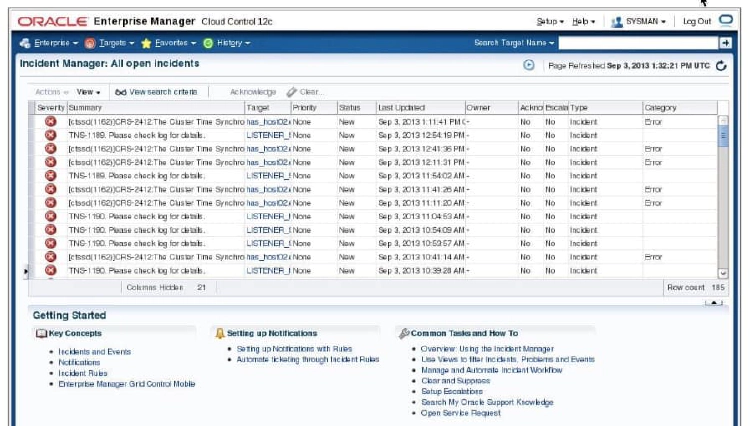
You can use Enterprise Manager to administer alerts for RAC environments. Enterprise Manager distinguishes between database and instance-level alerts in RAC environments.
Enterprise Manager also responds to metrics from across the entire RAC database and publishes alerts when thresholds are exceeded. Enterprise Manager interprets both predefined and customized metrics. You can also copy customized metrics from one cluster database instance to another, or from one RAC database to another. A recent alert summary can be found on the Cluster Database Home page. Notice that alerts are sorted by relative time and target name.
Enterprise Manager Metrics and RAC
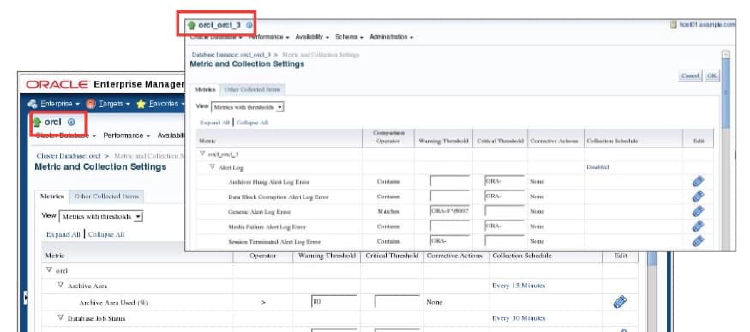
Alert thresholds for instance-level alerts, such as archive log alerts, can be set at the instance target level. This enables you to receive alerts for the specific instance if performance exceeds your threshold. You can also configure alerts at the database level, such as setting alerts for tablespaces. This enables you to avoid receiving duplicate alerts at each instance.
Enterprise Manager Blackouts and RAC
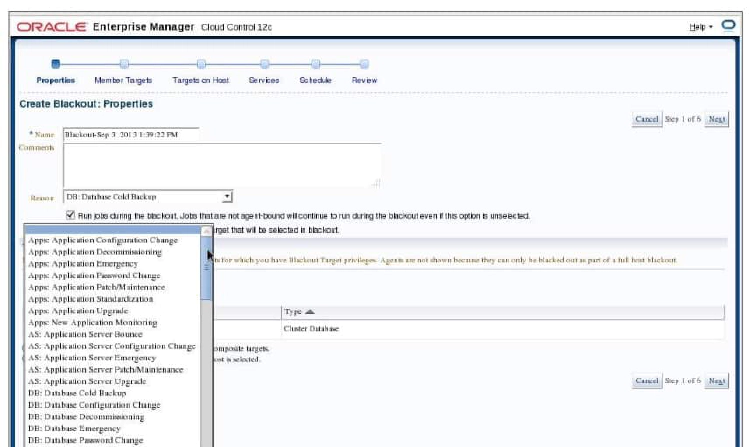
You can use Enterprise Manager to define blackouts for all managed targets of your RAC database to prevent alerts from being recorded. Blackouts are useful when performing scheduled or unscheduled maintenance or other tasks that might trigger extraneous or unwanted events. You can define blackouts for an entire cluster database or for specific cluster database instances.
To create a blackout event, select Control and then Create Blackouts from the Cluster Database pull-down menu. Click the Create button. The Create Blackout: Properties page appears. You must enter a name or tag in the Name field. If you want, you can also enter a descriptive comment in the Comments field. This is optional. Enter a reason for the blackout in the Reason field.
In the Targets area of the Properties page, you must choose a target Type from the drop-down list. Click the cluster database in the Available Targets list, and then click the Move button to move your choice to the Selected Targets list. Click the Next button to continue. The Member Targets page appears next. Expand the Selected Composite Targets tree and ensure that all targets that must be included appear in the list. Continue and define your schedule in accordance to your needs.
Enterprise Manager Database Express
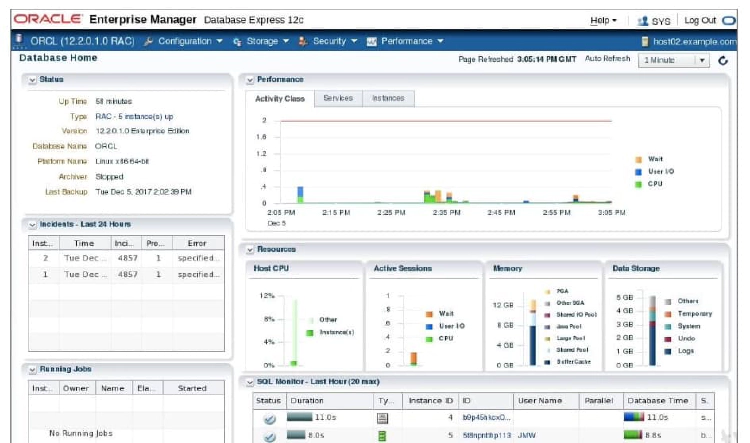
Enterprise Manager Database Express is designed to be lightweight and to incur minimal overhead on the database server. In order to achieve this goal, EM Express is built inside the Oracle Database and only uses internal infrastructure components such as XDB and SQL*Net. It does not require any separate middle-tier components. Because EM Express is built inside the database, the database has to be open in order to use EM Express, and EM Express cannot perform actions outside the database.
EM Express does not have background tasks or processes that periodically collect information. Instead, it uses data that is already collected by the database. Data is requested only when the user interacts with the UI and all UI processing is done in the browser, thus minimizing load on the database server.
EM Express is a database management tool that is automatically RAC-aware. When connected to a RAC system, the information displayed is for the entire database, that is, for all instances. For example, the average active session values is aggregated across all instances. In addition, an extra Instances tab is displayed in the Performance Region on the DB Home Page to show the distribution of average active sessions across instances.
EM Express provides support for CDB. Users can configure EM Express both at the root and the PDB containers, with each container using a different HTTPS/HTTP port.