How to View and Test Current Network Configuration in CentOS/RHEL
Starting from CentOS/RHEL 7, various new features have been introduced in the network stack as well. This post will touch base upon how to test and inspect current network configuration with command-line utilities in CentOS/RHEL 7 and 8.
Identifying Network Interfaces
The ip link command will list all network interfaces available on your system:
[user@host ~]$ ip link show
1: lo:  mtu 65536 qdisc noqueue state UNKNOWN mode DEFAULT group default qlen 1000
	link/loopback 00:00:00:00:00:00 brd 00:00:00:00:00:00
2: ens3:  mtu 1500 qdisc mq state UP mode DEFAULT group default qlen 1000
	link/ether 52:54:00:00:00:0a brd ff:ff:ff:ff:ff:ff
3: ens4:  mtu 1500 qdisc mq state UP mode DEFAULT group default qlen 1000
	link/ether 52:54:00:00:00:1e brd ff:ff:ff:ff:ff:ff
In the preceding example, the server has three network interfaces: lo, which is the loopback device that is connected to the server itself, and two Ethernet interfaces, ens3 and ens4.
To configure each network interface correctly, you need to know which one is connected to which network. In many cases, you will know the MAC address of the interface connected to each network, either because it is physically printed on the card or server, or because it is a virtual machine and you know how it is configured. The MAC address of the device is listed after link/ether for each interface. So you know that the network card with the MAC address 52:54:00:00:00:0a is the network interface ens3.
Displaying IP Addresses
Use the ip command to view device and address information. A single network interface can have multiple IPv4 or IPv6 addresses.
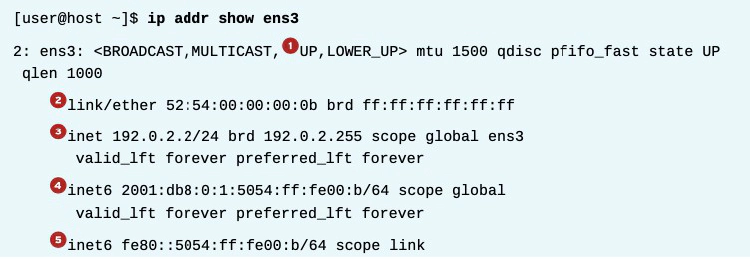
- An active interface is UP.
- The link/ether line specifies the hardware (MAC) address of the device.
- The inet line shows an IPv4 address, its network prefix length, and scope.
- The inet6 line shows an IPv6 address, its network prefix length, and scope. This address is of global scope and is normally used.
- This inet6 line shows that the interface has an IPv6 address of link scope that can only be used for communication on the local Ethernet link.
Displaying Performance Statistics
The ip command may also be used to show statistics about network performance. Counters for each network interface can be used to identify the presence of network issues. The counters record statistics for things like the number of received (RX) and transmitted (TX) packets, packet errors, and packets that were dropped.
[user@host ~]$ ip -s link show ens3
2: ens3:  mtu 1500 qdisc pfifo_fast state UP qlen
  1000
link/ether 52:54:00:00:00:0a brd ff:ff:ff:ff:ff:ff
	RX: bytes  packets  errors  dropped overrun mcast
	269850     2931     0       0       0       0
	TX: bytes  packets  errors  dropped carrier collsns
	300556     3250     0       0       0       0
Checking Connectivity Between Hosts
The ping command is used to test connectivity. The command continues to run until Ctrl+C is pressed unless options are given to limit the number of packets sent.
[user@host ~]$ ping -c3 192.0.2.254
PING 192.0.2.1 (192.0.2.254) 56(84) bytes of data.
64 bytes from 192.0.2.254: icmp_seq=1 ttl=64 time=4.33 ms
64 bytes from 192.0.2.254: icmp_seq=2 ttl=64 time=3.48 ms
64 bytes from 192.0.2.254: icmp_seq=3 ttl=64 time=6.83 ms

--- 192.0.2.254 ping statistics --
3 packets transmitted, 3 received, 0% packet loss, time 2003ms
rtt min/avg/max/mdev = 3.485/4.885/6.837/1.424 ms
The ping6 command is the IPv6 version of ping in Red Hat Enterprise Linux. It communicates over IPv6 and takes IPv6 addresses, but otherwise works like ping.
[user@host ~]$ ping6 2001:db8:0:1::1
PING 2001:db8:0:1::1(2001:db8:0:1::1) 56 data bytes
64 bytes from 2001:db8:0:1::1: icmp_seq=1 ttl=64 time=18.4 ms
64 bytes from 2001:db8:0:1::1: icmp_seq=2 ttl=64 time=0.178 ms
64 bytes from 2001:db8:0:1::1: icmp_seq=3 ttl=64 time=0.180 ms
 ^C
--- 2001:db8:0:1::1 ping statistics --
3 packets transmitted, 3 received, 0% packet loss, time 2001ms
rtt min/avg/max/mdev = 0.178/6.272/18.458/8.616 ms
[user@host ~]$
When you ping link-local addresses and the link-local all-nodes multicast group (ff02::1), the network interface to use must be specified explicitly with a scope zone identifier (such as ff02::1%ens3). If this is left out, the error connect: Invalid argument is displayed.
Pinging ff02::1 can be useful for finding other IPv6 nodes on the local network.
[user@host ~]$ ping6 ff02::1%ens4
PING ff02::1%ens4(ff02::1) 56 data bytes
64 bytes from fe80::78cf:7fff:fed2:f97b: icmp_seq=1 ttl=64 time=22.7 ms
64 bytes from fe80::f482:dbff:fe25:6a9f: icmp_seq=1 ttl=64 time=30.1 ms (DUP!)
64 bytes from fe80::78cf:7fff:fed2:f97b: icmp_seq=2 ttl=64 time=0.183 ms
64 bytes from fe80::f482:dbff:fe25:6a9f: icmp_seq=2 ttl=64 time=0.231 ms (DUP!)
 ^C
--- ff02::1%ens4 ping statistics --
2 packets transmitted, 2 received, +2 duplicates, 0% packet loss, time 1001ms
rtt min/avg/max/mdev = 0.183/13.320/30.158/13.374 ms
[user@host ~]$ ping6 -c 1 fe80::f482:dbff:fe25:6a9f%ens4
PING fe80::f482:dbff:fe25:6a9f%ens4(fe80::f482:dbff:fe25:6a9f) 56 data bytes
64 bytes from fe80::f482:dbff:fe25:6a9f: icmp_seq=1 ttl=64 time=22.9 ms

--- fe80::f482:dbff:fe25:6a9f%ens4 ping statistics --
1 packets transmitted, 1 received, 0% packet loss, time 0ms
rtt min/avg/max/mdev = 22.903/22.903/22.903/0.000 ms
Remember that IPv6 link-local addresses can be used by other hosts on the same link, just like normal addresses.
[user@host ~]$ ssh fe80::f482:dbff:fe25:6a9f%ens4
user@fe80::f482:dbff:fe25:6a9f%ens4's password:
Last login:  Thu Jun  5 15:20:10 2014 from host.example.com
[user@server ~]$
Troubleshooting Routing
Network routing is complex, and sometimes traffic does not behave as you might have expected. Here are some useful diagnosis tools.
Displaying the Routing Table
Use the ip command with the route option to show routing information.
[user@host ~]$ ip route
default via 192.0.2.254 dev ens3 proto static metric 1024
192.0.2.0/24 dev ens3 proto kernel scope link src 192.0.2.2
10.0.0.0/8 dev ens4 proto kernel scope link src 10.0.0.11
This shows the IPv4 routing table. All packets destined for the 10.0.0.0/8 network are sent directly to the destination through the device ens4. All packets destined for the 192.0.2.0/24 network are sent directly to the destination through the device ens3. All other packets are sent to the default router located at 192.0.2.254, and also through device ens3.
Add the -6 option to show the IPv6 routing table:
[user@host ~]$ ip -6 route
unreachable ::/96 dev lo  metric 1024  error -101
unreachable ::ffff:0.0.0.0/96 dev lo  metric 1024  error -101
2001:db8:0:1::/64 dev ens3  proto kernel  metric 256
unreachable 2002:a00::/24 dev lo  metric 1024  error -101
unreachable 2002:7f00::/24 dev lo  metric 1024  error -101
unreachable 2002:a9fe::/32 dev lo  metric 1024  error -101
unreachable 2002:ac10::/28 dev lo  metric 1024  error -101
unreachable 2002:c0a8::/32 dev lo  metric 1024  error -101
unreachable 2002:e000::/19 dev lo  metric 1024  error -101
unreachable 3ffe:ffff::/32 dev lo  metric 1024  error -101
fe80::/64 dev ens3  proto kernel  metric 256
default via 2001:db8:0:1::ffff dev ens3  proto static  metric 1024
In this example, ignore the unreachable routes, which point at unused networks. That leaves three routes:
- The 2001:db8:0:1::/64 network, using the ens3 interface (which presumably has an address on that network).
- The fe80::/64 network, using the ens3 interface, for the link-local address. On a system with multiple interfaces, there is a route to fe80::/64 out each interface for each link-local address.
- A default route to all networks on the IPv6 Internet (the ::/0 network) that do not have a more specific route on the system, through the router at 2001:db8:0:1::ffff, reachable with the ens3 device.
Tracing Routes Taken by Traffic
To trace the path that network traffic takes to reach a remote host through multiple routers, use either traceroute or tracepath. This can identify whether an issue is with one of your routers or an intermediate one. Both commands use UDP packets to trace a path by default; however, many networks block UDP and ICMP traffic. The traceroute command has options to trace the path with UDP (default), ICMP (-I), or TCP (-T) packets. Typically, however, the traceroute command is not installed by default.
[user@host ~]$ tracepath thegeeksearch.com
...output omitted...
4:  71-32-28-145.rcmt.qwest.net                          48.853ms asymm  5
5:  dcp-brdr-04.inet.qwest.net                          100.732ms asymm  7
6:  206.111.0.153.ptr.us.xo.net                          96.245ms asymm  7
7:  207.88.14.162.ptr.us.xo.net                          85.270ms asymm  8
8:  ae1d0.cir1.atlanta6-ga.us.xo.net                     64.160ms asymm  7
9:  216.156.108.98.ptr.us.xo.net                        108.652ms
10:  bu-ether13.atlngamq46w-bcr00.tbone.rr.com          107.286ms asymm 12
...output omitted...
Each line in the output of tracepath represents a router or hop that the packet passes through between the source and the final destination. Additional information is provided as available, including the round trip timing (RTT) and any changes in the maximum transmission unit (MTU) size. The asymm indication means traffic reached that router and returned from that router using different (asymmetric) routes. The routers shown are the ones used for outbound traffic, not the return traffic.
The tracepath6 and traceroute -6 commands are the equivalent to tracepath and traceroute for IPv6.
[user@host ~]$ tracepath6 2001:db8:0:2::451
1?: [LOCALHOST]                        0.091ms pmtu 1500
1:  2001:db8:0:1::ba                   0.214ms
2:  2001:db8:0:1::1                    0.512ms
3:  2001:db8:0:2::451      0.559ms reached
 Resume: pmtu 1500 hops 3 back 3
Troubleshooting Ports and Services
TCP services use sockets as endpoints for communication and are made up of an IP address, protocol, and port number. Services typically listen on standard ports while clients use a random available port. Well-known names for standard ports are listed in the /etc/services file.
The ss command is used to display socket statistics. The ss command is meant to replace the older tool netstat, part of the net-tools package, which may be more familiar to some system administrators but which is not always installed.
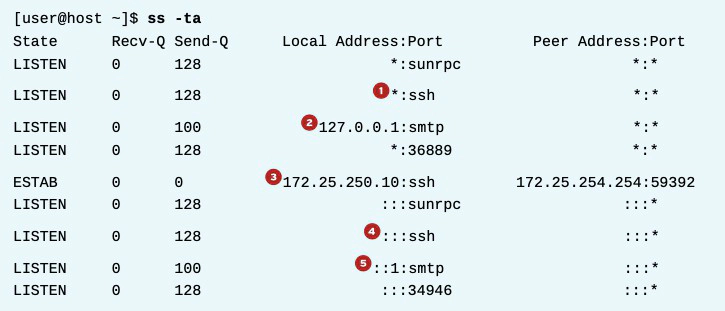
- The port used for SSH is listening on all IPv4 addresses. The “*” is used to represent “all” when referencing IPv4 addresses or ports.
- The port used for SMTP is listening on the 127.0.0.1 IPv4 loopback interface.
- The established SSH connection is on the 172.25.250.10 interface and originates from a system with an address of 172.25.254.254.
- The port used for SSH is listening on all IPv6 addresses. The “::” syntax is used to represent all IPv6 interfaces.
- The port used for SMTP is listening on the ::1 IPv6 loopback interface.
Options for ss and netstat
| OPTION | DESCRIPTION |
|---|---|
| -n | Show numbers instead of names for interfaces and ports. |
| -t | Show TCP sockets. |
| -u | Show UDP sockets. |
| -l | Show only listening sockets. |
| -a | Show all (listening and established) sockets. |
| -p | Show the process using the sockets. |
| -A inet | Display active connections (but not listening sockets) for the inet address family. That is, ignore local UNIX domain sockets. For ss, both IPv4 and IPv6 connections are displayed. For netstat, only IPv4 connections are displayed. (netstat -A inet6 displays IPv6 connections, and netstat -46 displays IPv4 and IPv6 at the same time.) |